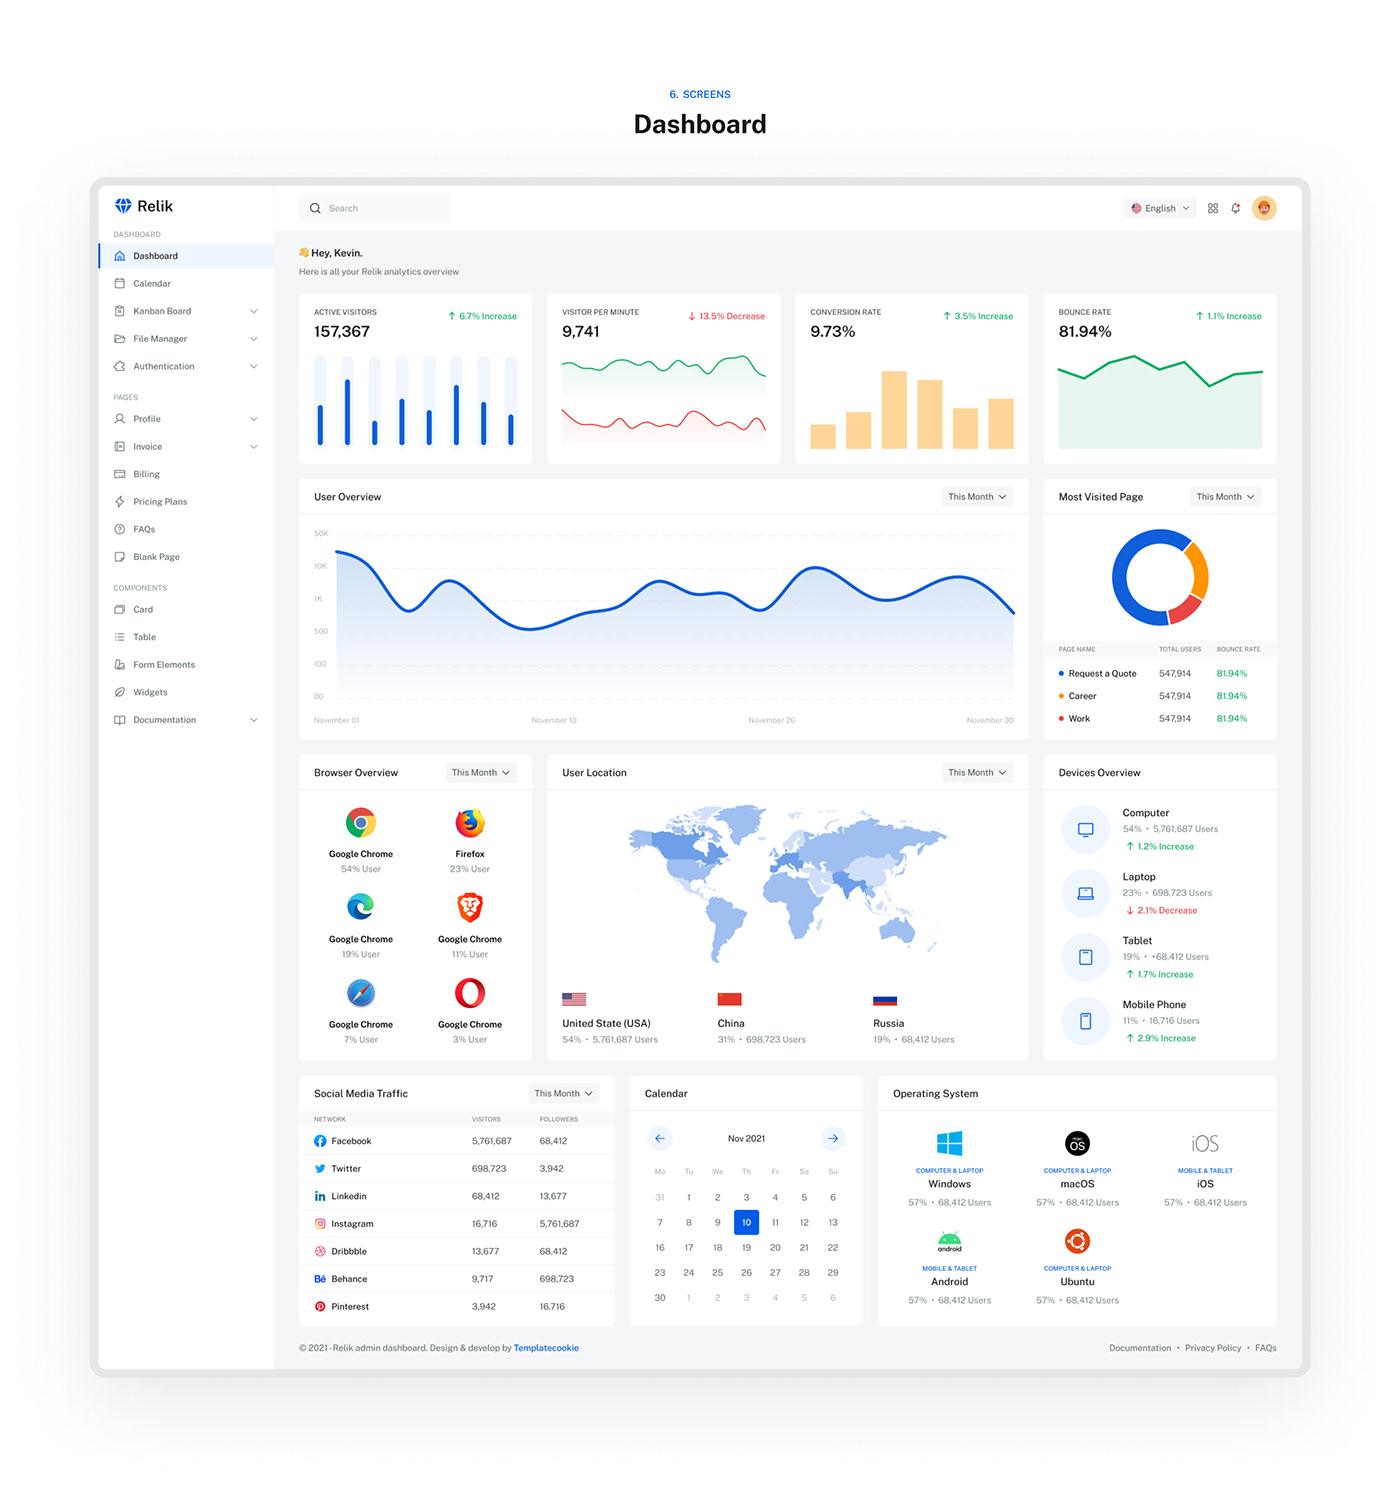
An Analytics Dashboard is a powerful digital interface that consolidates real-time and historical energy data into an intuitive platform, allowing users to track, analyze, and optimize renewable energy systems with ease. Designed for solar, wind, storage, and hybrid setups, it provides a comprehensive view of critical metrics such as energy generation, consumption patterns, battery status, grid exports, and overall system efficiency. With customizable charts, graphs, and key performance indicators (KPIs), the dashboard transforms complex data into actionable insights, enabling homeowners, businesses, and utilities to make informed decisions that improve efficiency and reduce costs. Advanced dashboards often integrate AI and machine learning to forecast energy production, predict consumption trends, and recommend optimization strategies, ensuring systems run at peak performance. For residential users, an analytics dashboard provides transparency into how much energy is being produced, stored, and used daily, offering insights into savings and environmental benefits. In commercial and industrial environments, it helps managers oversee multiple sites, compare performance, detect inefficiencies, and monitor compliance with energy goals. Utility-scale operators benefit from centralized control, enabling the monitoring of thousands of assets across wide areas with predictive maintenance alerts to prevent downtime. Many dashboards are cloud-based with mobile app access, allowing users to view performance from anywhere, while secure encryption and role-based access ensure data safety. Additionally, they often support integration with IoT devices, demand response programs, and smart grids, creating a unified energy management ecosystem. Automated alerts notify users of faults, shading, or abnormal performance, helping address issues quickly and efficiently. Beyond monitoring, dashboards support sustainability reporting by generating detailed summaries of carbon reductions, renewable usage, and cost savings, which can be shared with stakeholders, regulators, or customers. While setup may involve integrating hardware and data sources, the long-term benefits include improved visibility, operational efficiency, and higher return on investment. By adopting an analytics dashboard, users gain the ability to transform raw energy data into actionable intelligence, ensuring smarter energy usage, greater system reliability, and meaningful progress toward sustainability goals. This makes analytics dashboards an indispensable tool for modern renewable energy management.